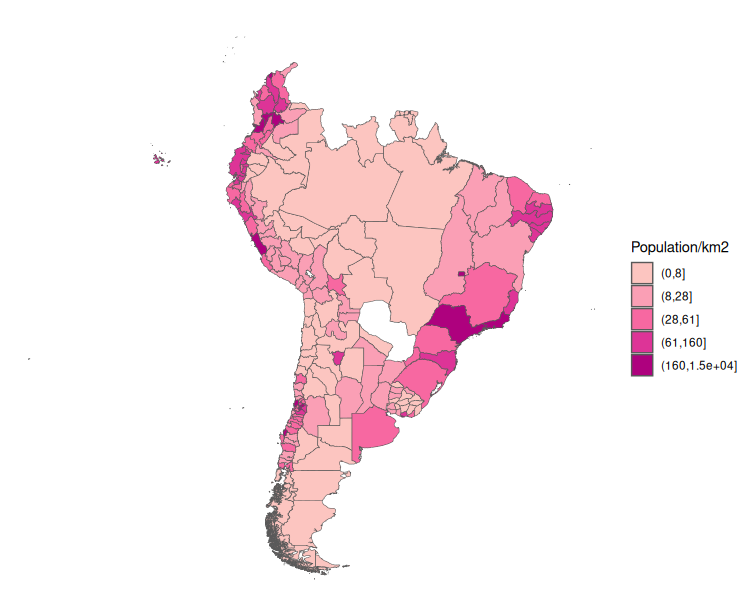
Population density in South America
As I’ve been listening to a lot of latin american music lately, I wanted to find data on Latin/South America and found the IPUMS databases based on different countries’ national statistics. South America has vast areas with very low population counts, like the Amazon or Pampas, so you couldn’t represent a country’s population with one average figure. Therefore I needed data on a lower area level, and IPUMS holds that at the harmonised ‘GEOLEVEL 1’, the first subnational geographic level, that has been made consistent across the world and over time. IPUMS provides a shapefile for this.
A caveat of a data collection this large are that years every country has provided them vary. Here, I’ve selected areas that have provided population density data in 2010 or later. This does exclude Venezuela and Paraguay.
For the first map, I’ve used R’s ggplot with geom_sf which colours polygons by the density group. However, I’d like to see the exact density of each region, with its name and country it belongs to - and there are some that just look like a grey bundle due to their size. So I used leaflet to make an interactive map in which you can click on each region and zoom in and out. (I struggled for a while with trying to add text or a tooltip onto each geolevel1, but it looks like neither the text option in geom_sf or plotly’s tooltip work - any updates on this, please let me know!)
You can find the code in my GitHub.
Data: Minnesota Population Center. Integrated Public Use Microdata Series, International: Version 7.3. Population density in South America. Minneapolis, MN: IPUMS, 2020. https://doi.org/10.18128/D020.V7.3
.png)